Healthcare Experience Engine
My Role
- Qualitative Research
- Data Design
- Interactive Journey Map Design
- Formal Journey Map Creation
Summary
Healthcare is a highly complex industry. How can an organization collect research findings in such a way to align with just-in-time development efforts?
Problem
Research findings are collected and only shared in difficult-to-query reports.
Participants share feedback across multiple aspects of the overall healthcare continuum - beyond the subject of a single report. How can an organization contextualize years of qualitative and evaluative findings be used to support ongoing development efforts?
Solution Overview
- Create the Healthcare Experience Engine
- Provide a single shared understanding of the broad experience of the people we serve.
- Allow generative research studies to be coded more efficiently.
- Establish a single, flexible, coding convention to be used across diverse studies.
- Let different studies be synthesized together (validly), even if they are focused on different phases of the healthcare experience.
Process
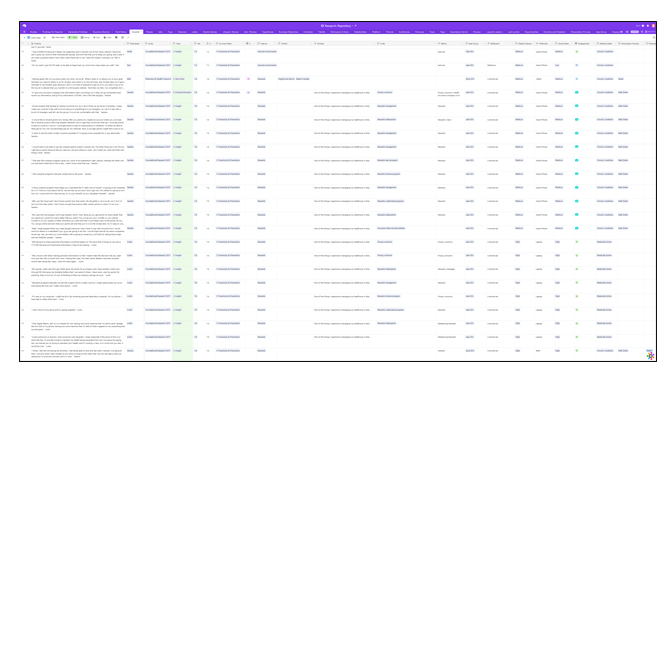
- Created an AirTable Base for research findings.
- Designed a process of coding field interviews that would align them with the overall healthcare continuum, as well as align them with jobs and features.
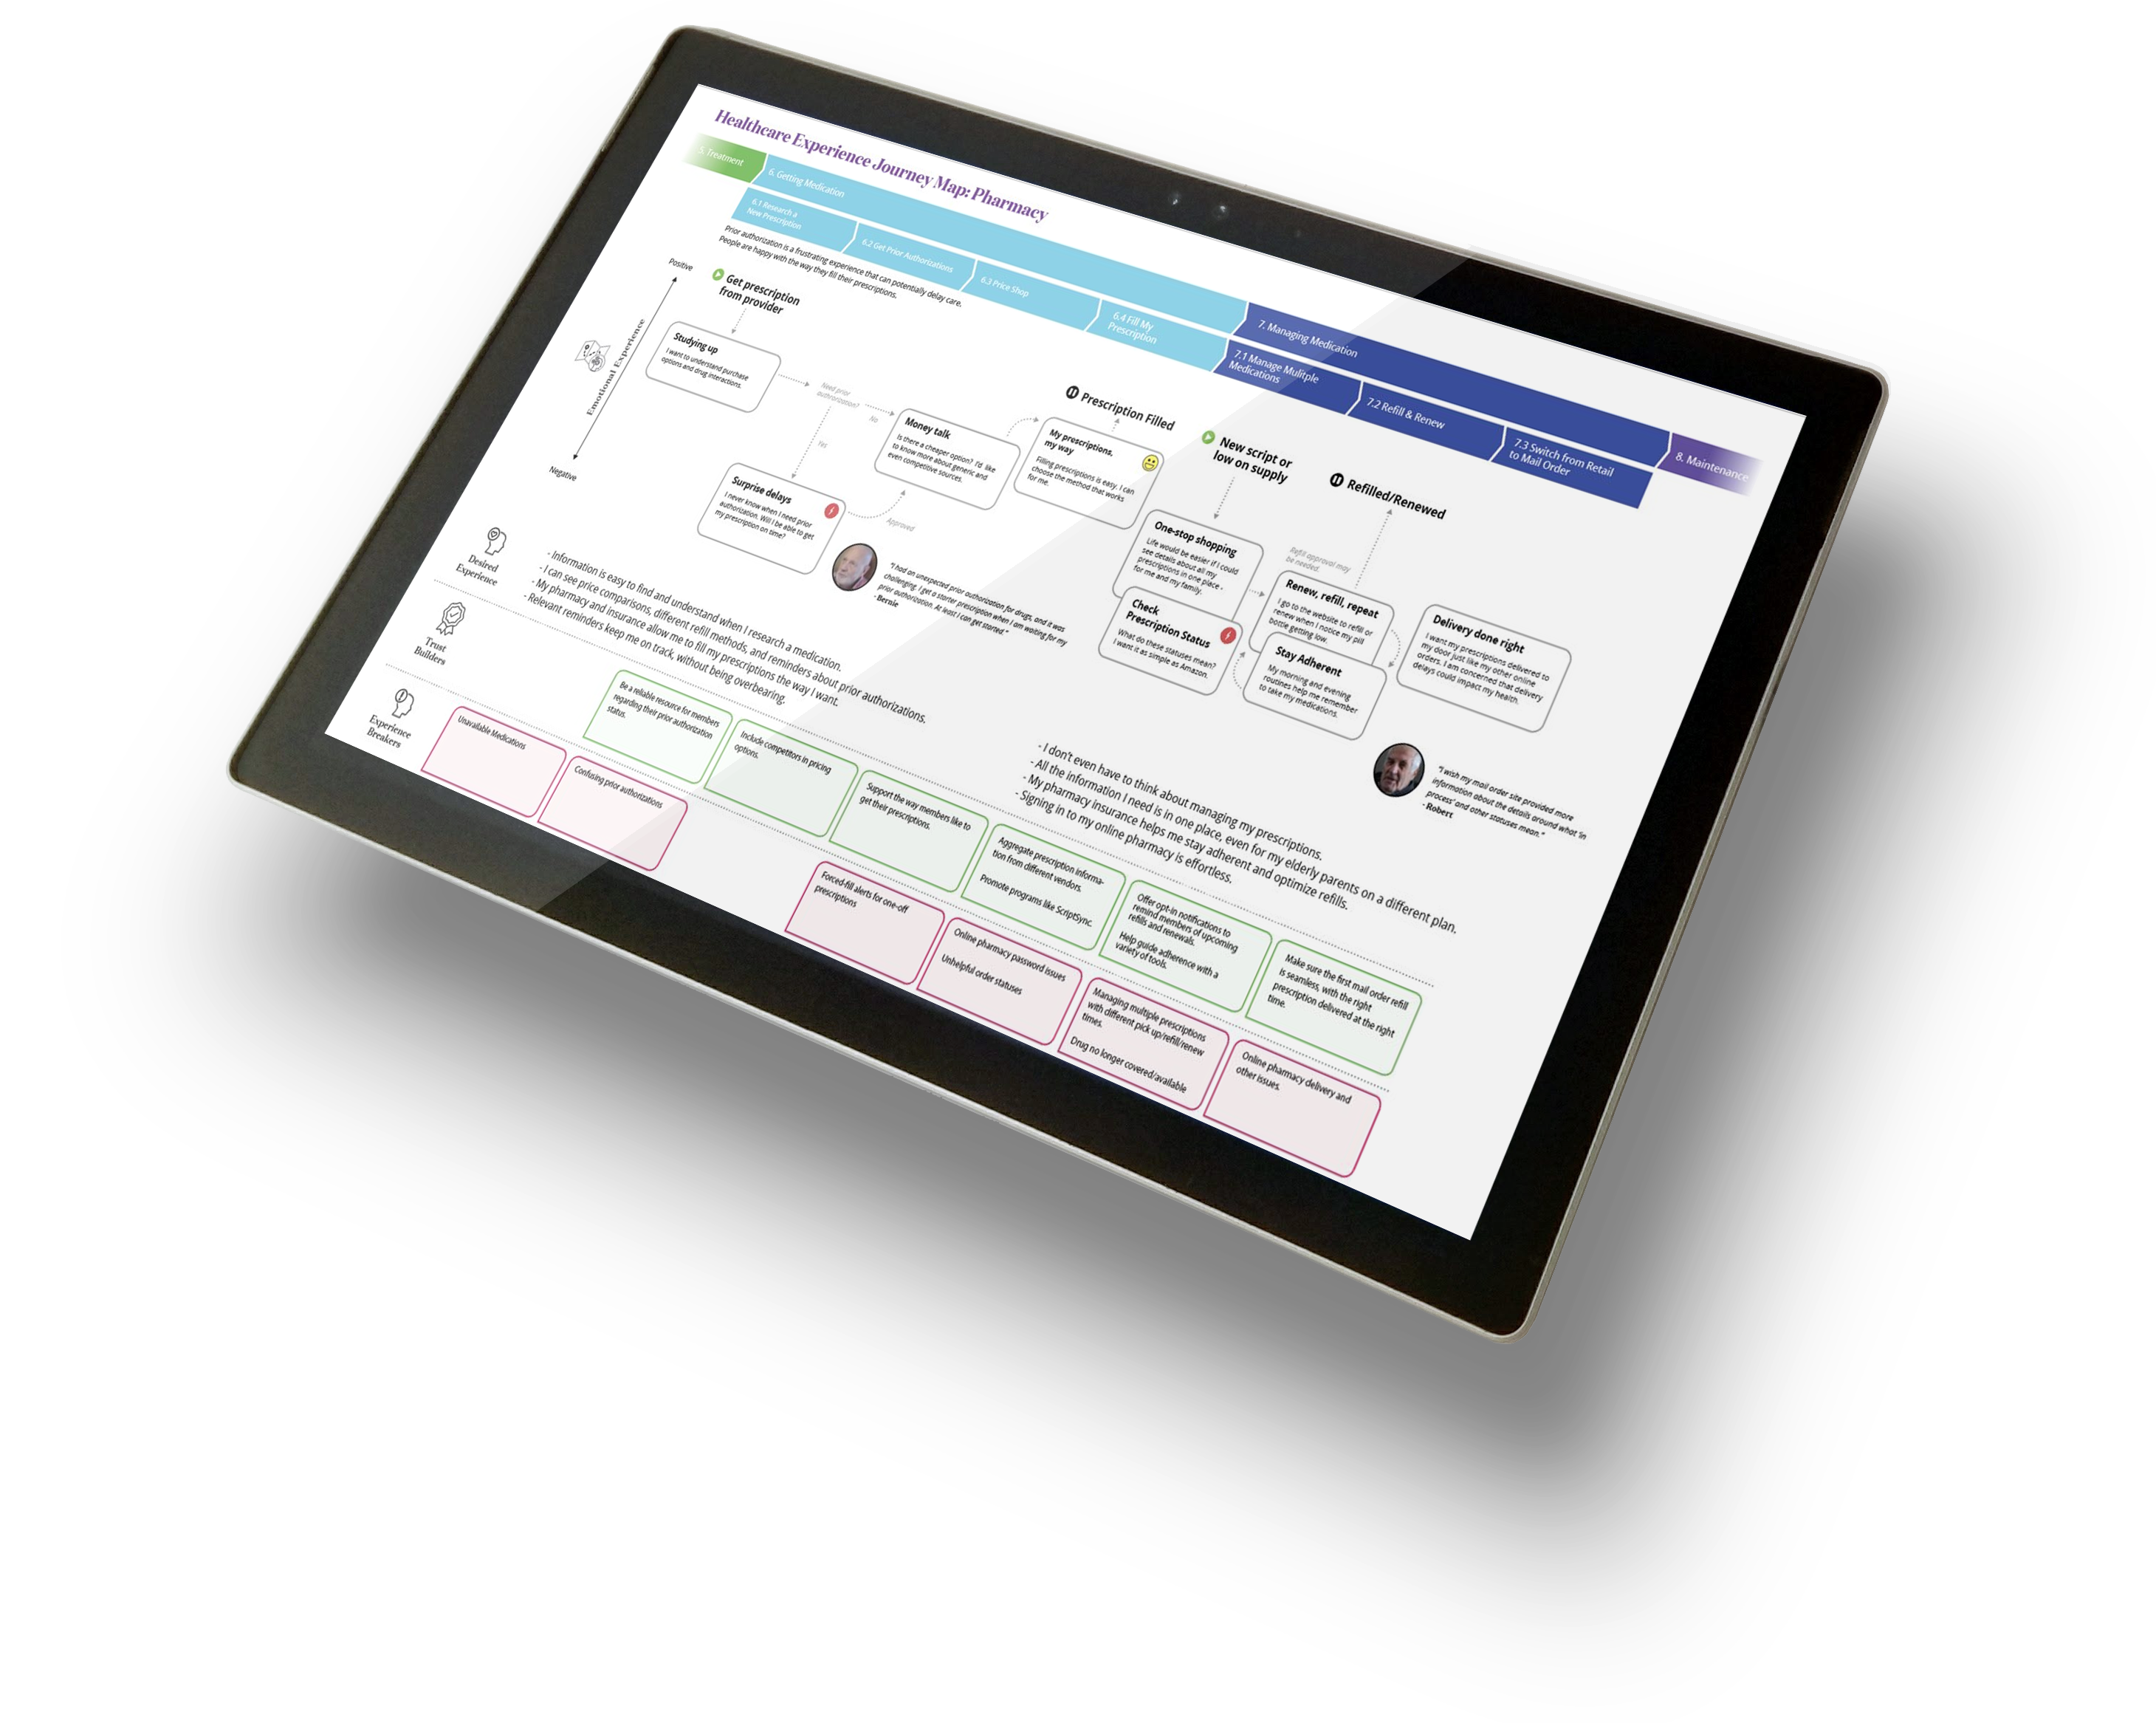
- Created an interactive journey map that changes the journey based on selected criteria of an audience.
- Processed retrospective findings into,
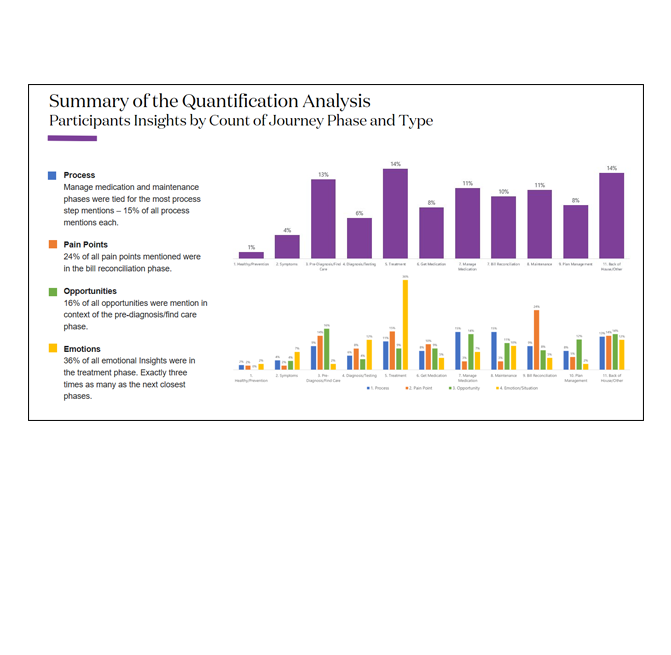
Quantify Qualitative Data
AirTable data is exported into CSV to drive the interactive journey map. Using qualitative data quantitatively can expose trends that may not have been apparent in the original feedback.
The interactive journey map allows researchers to sort based on different demographic and clinical criteria in order to see how the journey changes.
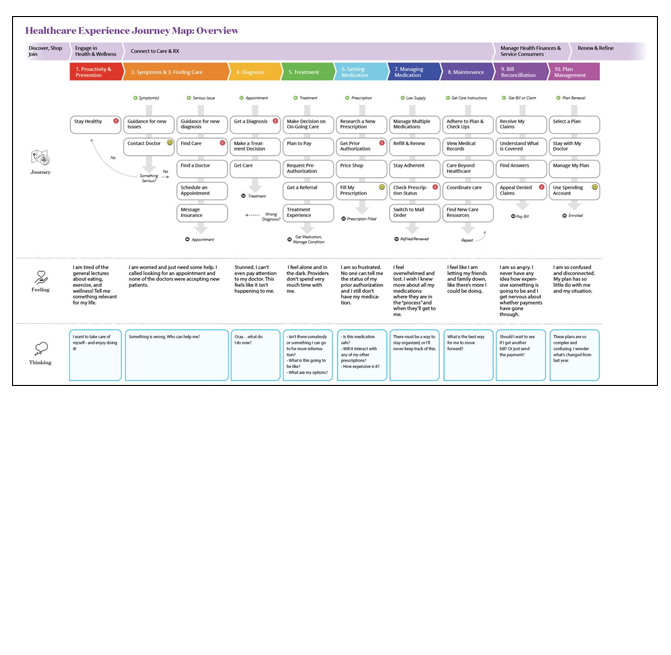
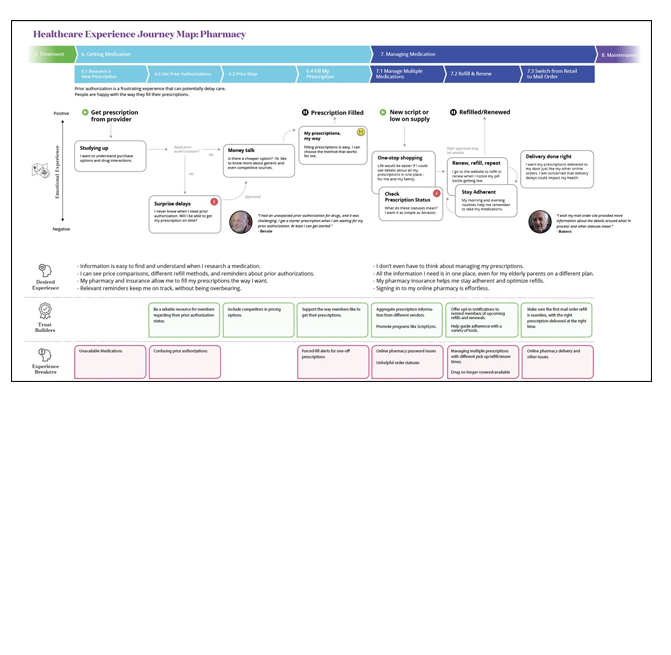
Nested views of the journey
The 2018 field study included a focus on pharmacy management and health finances. Those two sections of the healthcare journey were displayed as their own journey sections. As future studies of different areas are created, the experience engine is designed to allow the creation of nested journey maps.
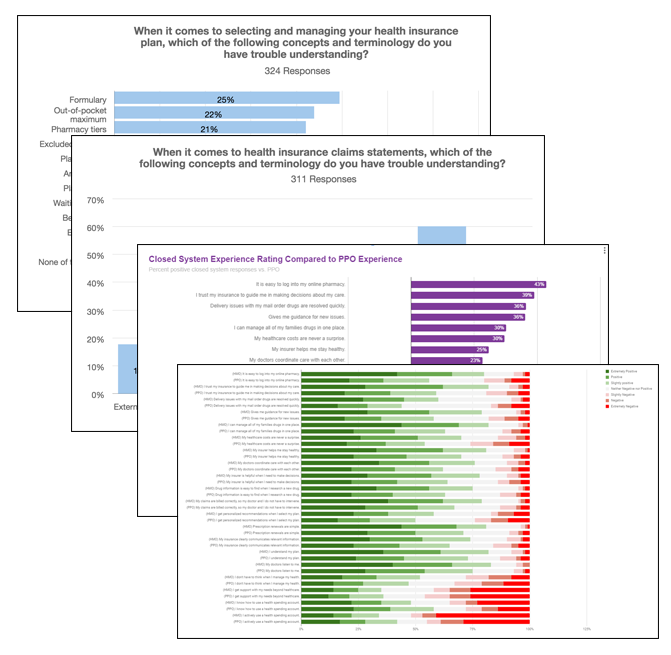
The contextualized findings lead to a series of specific studies.
Many areas are open for exploration, from what people don’t understand about their health insurance to are people in closed health system happier? These studies and other are able to be stored in the same data repository and be assessed based on journey, customer demographic, or feature.